Red cell life span heterogeneity in hematologically…
Red cell life span heterogeneity in hematologically normal people is sufficient to alter HbA1c
Robert M. Cohen, Robert S. Franco, Paramjit K. Khera, Eric P. Smith, Christopher J. Lindsell, Peter J. Ciraolo, Mary B. Palascak, Clinton H. Joiner
Abstract
Although red blood cell (RBC) life span is a known determinant of percentage hemoglobin A1c (HbA1c), its variation has been considered insufficient to affect clinical decisions in hematologically normal persons. However, an unexplained discordance between HbA1c and other measures of glycemic control can be observed that could be, in part, the result of differences in RBC life span. To explore the hypothesis that variation in RBC life span could alter measured HbA1c sufficiently to explain some of this discordance, we determined RBC life span using a biotin label in 6 people with diabetes and 6 nondiabetic controls. Mean RBC age was calculated from the RBC survival curve for all circulating RBCs and for labeled RBCs at multiple time points as they aged. In addition, HbA1c in magnetically isolated labeled RBCs and in isolated transferrin receptor-positivereticulocytes was used to determine the in vivo synthetic rate of HbA1c. The mean age of circulating RBCs ranged from 39 to 56 days in diabetic subjects and 38 to 60 days in nondiabetic controls. HbA1c synthesis was linear and correlated with mean whole blood HbA1c (R2 = 0.91). The observed variation in RBC survival was large enough to cause clinically important differences in HbA1c for a given mean blood glucose.
Topics:hemoglobin a, glycosylated, erythrocyte life span
Introduction
The hemoglobin A1c (HbA1c) determination used clinically to evaluate glycemic control depends on 3 factors: (1) the HbA1c in reticulocytes when they are released from the bone marrow; (2) the synthetic rate of HbA1c (or Hb glycation rate) as red blood cells (RBCs) become older, a function of glucose concentration to which Hb is exposed; and (3) the mean age of RBCs in the circulation. Blood HbA1c is a mean for RBCs with values that range from very low for reticulocytes to approximately twice the mean for the oldest RBCs. The value of HbA1c in transferrin receptor-positive (TfR(+)) cells, which are essentially reticulocytes, most probably depends on the glucose milieu in the marrow a few days preceding release and could potentially reflect a different rate of glycation compared with mature RBCs resulting from variations in environment and glucose transport. The synthetic rate of HbA1c as RBCs age in the circulation is the variable that should be most directly related to blood glucose over a defined time period. Its linearity with time is largely based on a seminal observation with one normal subject and one subject recovering from erythrocyte aplasia in whom the appearance of 59Fe in the HbA1c fraction was found to lag behind the appearance in the HbA fraction and the time course of the specific activity of 59Fe in the HbA1c fraction was linear.1 The relationship of synthetic rate to blood glucose and the agreement of the single subject in vivo kinetics to in vitro kinetics were established very shortly thereafter.2 However, the invariance of synthetic rate between persons in the face of potential modifiers has largely been assumed3 and becomes an issue as ever greater precision in glycemic control and the identification of more precise targets for complication prevention are explored. RBC life span, which determines the duration of exposure of hemoglobin to glucose, has been assumed to fall within a narrow range in hematologically normal subjects and thus have no significant effect on HbA1c.4,5 However, normal RBC life span has been reported to have a wide range of values regardless of the method used,6-8 and there are also studies suggesting that RBC life span may depend on glycemic control, although evidence for this is conflicting.9-13 It is also possible that heterogeneity in other features of red cell physiology, such as membrane glucose transport14 and loss of Hb from older RBCs,15 may influence the relationship between blood glucose and HbA1c.
A normal RBC progresses through several stages in the circulation, including a short period as a reticulocyte, a long period as a mature RBC, and a terminal, senescent state most probably of short duration.16 Under normal circumstances, all the cells in an age cohort of human erythroid cells released from the marrow at the same time go through these stages together.6 However, current cell labels do not measure the life span of an age cohort, but rather, the survival of a randomly labeled RBC sample that contains cells of all ages. For many years 51Cr, which binds tightly but noncovalently to hemoglobin,17-19 has been the standard label for RBC life span determinations. More recently, biotin has been introduced as a nonisotopic label that is covalently attached to red cell membrane proteins and detected by flow cytometry. Initially, Dale et al20-24 established the biotin method for evaluation of RBC aging in rabbits, and Russo et al used flow cytometry to demonstrate normal long-term survival for biotin-labeled RBC (B-RBC) in the same species.17 Similar studies in mice25 and dogs26 have confirmed the utility of B-RBC for in vivo red cell tracking. Cavill et al used B-RBCs and 51Cr-labeled RBCs to measure red cell mass in 19 human subjects and found no difference between the labels.27 Previous studies from us and others19 have demonstrated the equivalence of human red cell survival measured with the biotin and 51Cr labels. The biotin label used in these studies has a number of advantages compared with the standard 51Cr label, including no radioactivity, inexpensive and stable reagents, and multiparameter analysis on a cell-by-cell basis. There is little or no biotin elution as judged by fluorescence intensity and, in any event, it would have had no effect on quantitation of the positive cells. The biotin method is also more precise than the carbon monoxide method for determining RBC turnover8,28 because the fraction of CO that is derived from RBCs may be variable.
The biotin label allows the entire RBC life span to be measured, and the resulting curvilinear survival curves contain the information required to calculate mean RBC age at the time of labeling and also at subsequent times. In general terms, this analysis is possible because both the age distribution (and thus the mean age) and the survival curve of RBCs in the circulation are dependent on the survival characteristics of an age cohort. Even though age cohort survival is not measured, the RBC age distribution at the time of labeling and any subsequent time can be derived from the survival curve of labeled RBCs27 by adapting a method used to compute mean age of wild animals in catch-and-release studies.29,30 Of importance for the studies described here and in contrast to the 51Cr method, biotin-labeled RBCs can be recovered from the circulation for analysis of HbA1c.
Given the discordance between HbA1c and other measures of glycemic control observed in some subjects31-34 and the evidence for a range of RBC survival in previous studies,9,10,12,35 we sought to determine whether there is sufficient interindividual variation in RBC mean age to have an important effect on HbA1c. To maximize the probability of observing a wide range of life spans in a small number of subjects, patients with diabetes mellitus (DM) with discordance between HbA1c and serum fructosamine (FA) were selected. FA is a measure of glucose control that should be unaffected by RBC variability.36 We studied DM subjects and nondiabetic (NDM) controls (1) to determine whether reticulocyte HbA1c is a significant contributor to intersubject HbA1c variability, (2) to confirm that in vivo Hb glycation rate is constant with time and quantitate the glycation rate, (3) to examine RBC life span differences between subjects with and without diabetes, and (4) to estimate the range of RBC life span among subjects with diabetes. The starting value for Hb glycation in the circulation was measured in magnetically isolated TfR(+) reticulocytes, a younger subset of the entire reticulocyte population.37 The rate of Hb glycation was measured using biotin-labeled RBCs that were magnetically isolated at multiple time points as they aged in the circulation. RBC survival was determined from the disappearance of biotin-labeled cells and expressed as mean age of the RBC population at the time of labeling.29,30
Methods
Study subjects
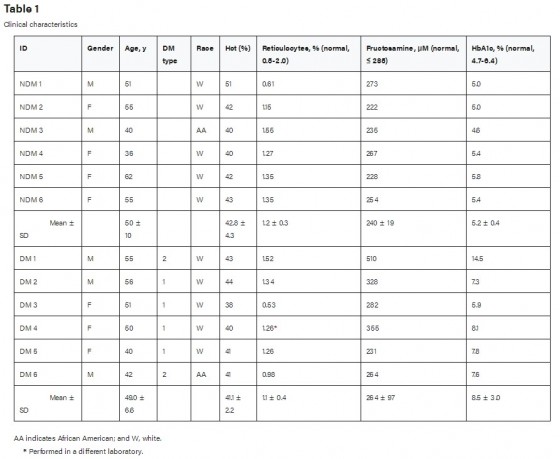
DM subjects (both type 1 and 2) were selected to represent a range of discordance between HbA1c and serum FA.36 Inclusion criteria were: age more than or equal to 14 years, either gender, and diabetes maintained at stable level of control. Exclusion criteria were: baseline serum creatinine more than 1.5 mg/dL, urine albumin more than 200 μg/min (timed collection) or more than 179 μg/mg creatinine (spot collection), transaminases more than 3 times the upper limit of normal, more than or equal to New York Heart Association stage III heart failure, hematocrit less than 34%, reticulocyte count more than 2%, evidence of hemoglobinopathy on high performance liquid chromatography (HPLC), history of gastrointestinal blood loss, pregnancy, blood bank donation or transfusion in previous 4 months, uncontrolled thyroid disease, active infection, and an underlying illness known to be associated with body wasting (eg, malignancies or tuberculosis). NDM subjects were recruited from the general population and were hematologically normal, ie, normal blood counts, cellular indices, and Hb HPLC analysis. The protocol was approved by the University of Cincinnati Institutional Review Board, and informed consent was obtained from all subjects in accordance with the Declaration of Helsinki.
HbA1c in TfR(+) cells
TfR(+) reticulocytes were isolated immunomagnetically using anti-TfR conjugated magnetic beads (Miltenyi Biotec, Auburn, CA) according to the manufacturer's protocol, except that the cells were passed through 2 magnetic columns in series to achieve a purity of more than 95% as determined by staining with the reticulocyte marker thiazole orange and flow cytometry. After isolation, the TfR(+) cells were washed, lysed, and analyzed by HPLC for HbA1c.37,38
Measurement of RBC life span
We used an ex vivo biotin label and flow cytometric quantitation to determine the survival of autologous RBCs.19,39 Approximately 30 mL of blood was obtained, and up to 10 mL of RBCs was labeled with NHS-biotin under sterile conditions as previously described39 with no more than 6 hours elapsing between the initial blood draw and reinfusion. Before reinfusion, a small aliquot of the labeled RBCs was incubated with streptavidin-phycoerythrin and analyzed by flow cytometry to assure that all the cells were labeled and that there was baseline separation of labeled and unlabeled cells on the flow cytometric histogram. Another small aliquot was sent for bacterial culture, which was negative for all subjects. The remaining labeled RBCs were reinfused through an 18-μm blood filter (Hem-O-Nate; Gesco, San Antonio, TX), and initial postinfusion blood samples were obtained after 10 minutes, 20 minutes, 2 hours, and 24 hours. Additional blood samples, were taken after 2 days, one week, 2 weeks, and then at 2-week intervals (total volume all samples ∼100 mL) until the fraction of biotinylated cells fell to less than one-twentieth of the starting fraction. There was no relationship between the intensity of labeling within the narrow range achieved and the measured RBC life span, and the 24-hour loss of labeled RBC was minimal (3.5% ± 3.9%), indicating little RBC damage during processing. Nevertheless, we used the percentage of labeled cells at 24 hours as the baseline for calculations. For a typical postinfusion-labeled cell fraction of 0.005 and flow cytometric analysis of 106 cells, there were approximately 5000 positive cells. At the end of the experiment, there were approximately 250 positive cells. The false positive background for this assay is approximately 10 per 106 cells.
Time course of B-RBC HbA1c
For selected postinfusion time points, labeled RBCs were isolated by streptavidin-coated magnetic beads (Dynal Biotech, Lake Success, NY) as previously described40 and the HbA1c content determined by HPLC.41 Parallel studies were also performed using another source of magnetic beads (Miltenyi Biotec) that gave very similar results (not shown). When plotted against time since reinfusion, the HbA1c values for the labeled RBCs increased linearly until approximately 90% of the labeled RBCs were removed from the circulation. We elected to analyze the data up to this point because it was not clear whether nonlinear HbA1c changes in the last remaining labeled RBCs (<10% of starting value) were artifactual resulting from the difficulty in isolating a pure population of labeled RBCs after that time.
Analysis of RBC life span
To calculate the mean RBC age at the time of labeling and at subsequent times after reinfusion, the following analytical sequence was used29 : (1) the fraction of labeled cells after 24 hours was taken as 100%; (2) a straight line between the final 2 points of the red cell survival curve was extrapolated to the time axis to give a maximum survival time; (3) a cubic fit of the RBC survival curve was performed; (4) the death rate as a function of time (first derivative of the survival curve) was generated; (5) the cell death rate was used to determine the initial cell age distribution as described29,30 ; (6) the initial mean age was calculated from the initial age distribution; and, finally, (7) the mean age at any postinfusion time, t, was determined using a similar strategy by recalculating the death rate function and age distribution at each time t from that time forward.29
In vivo Hb glycation rate determination
The analysis of RBC life span yields a mean RBC age for each point at which the HbA1c of isolated labeled RBCs was determined (see “In vivo HbA1c synthesis”), generating a plot of B-RBC HbA1c vs mean cell age. This plot includes cell ages ranging from the mean RBC age at the time of labeling (∼40-60 days) to the mean age of labeled RBCs at the end of the experiment. Glycation rate was determined as the linear regression slope of this plot.
Glycated hemoglobin assay
HbA1c was measured by an HPLC polyCAT resin column method41 able to detect an HbA1c peak as low as 0.1% of the HbA peak with the routine injection containing the equivalent of 0.2 μL of packed erythrocytes, with a coefficient of variation less than 4%. This quantity of cells allowed for determinations in the TfR(+) fraction of cells and the B-RBC fraction for the HbA1c formation rate. Except for the initial screening HbA1c laboratory tests (Table 1), degree of glycation is expressed as a unitless ratio or “fraction” calculated from the HPLC chromatogram as (HbA1c/HbA + HbA1c) to minimize the impact of other minor peaks.
Results
The study population is described in Table 1. Except in one subject (DM 1), whose HbA1c fraction rose from 0.113 to 0.146 (+ 3.80 × 10⁻⁴ HbA1c fraction/day), glycemic control was stable (<± 1 × 10⁻⁴ HbA1c fraction/day) during each subject's data collection.
HbA1c in TfR(+) RBCs
HbA1c fraction in TfR(+) cells from NDM persons was 0.0074 plus or minus 0.0007 (mean ± SD), in agreement with normal values reported by Brun et al.37 The corresponding value for DM subjects was 0.0132 plus or minus 0.0058 (Table 2). Not surprisingly, TfR(+) reticulocyte HbA1c correlated with initial whole blood HbA1c fraction, R2 = 0.82 (DM and NDM combined, Figure 1).
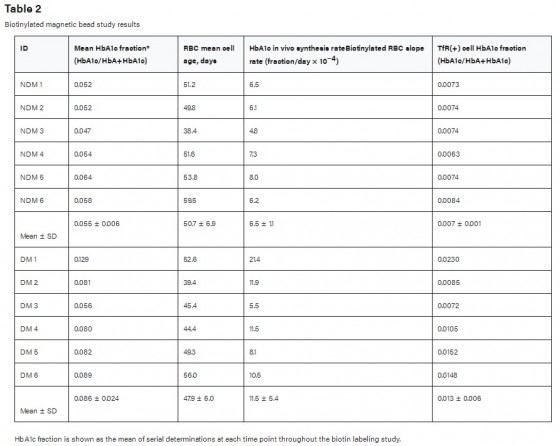
Figure 1
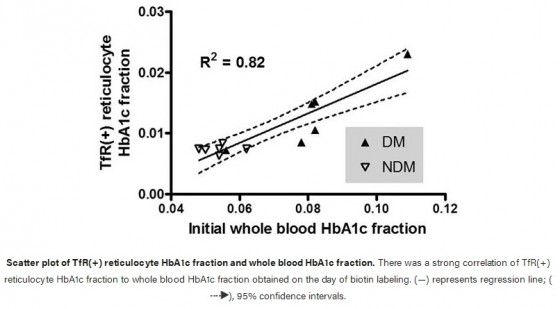
Scatter plot of TfR(+) reticulocyte HbA1c fraction and whole blood HbA1c fraction. There was a strong correlation of TfR(+) reticulocyte HbA1c fraction to whole blood HbA1c fraction obtained on the day of biotin labeling. (—) represents regression line; (), 95% confidence intervals.
HbA1c in biotin-labeled RBCs
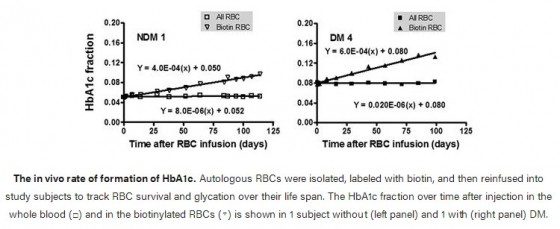
Biotin-labeled RBCs were isolated at selected postinfusion times with the aid of streptavidin-coated magnetic beads, and their hemoglobin composition determined by HPLC. Figure 2 shows representative data for 1 NDM (left) and 1 DM (right) subject in which the HbA1c fraction is plotted versus the time since reinfusion. The rate of increase in HbA1c fraction is linear and, as expected, noticeably greater in the diabetic subject. The HbA1c in unlabeled cells is plotted as a control and, in the subjects shown, was essentially constant throughout the period of observation as previously indicated.
Figure 2
VIEW LARGEDOWNLOAD PPT
The in vivo rate of formation of HbA1c. Autologous RBCs were isolated, labeled with biotin, and then reinfused into study subjects to track RBC survival and glycation over their life span. The HbA1c fraction over time after injection in the whole blood (□) and in the biotinylated RBCs (▿) is shown in 1 subject without (left panel) and 1 with (right panel) DM.
Red cell survival curves and calculated mean RBC age
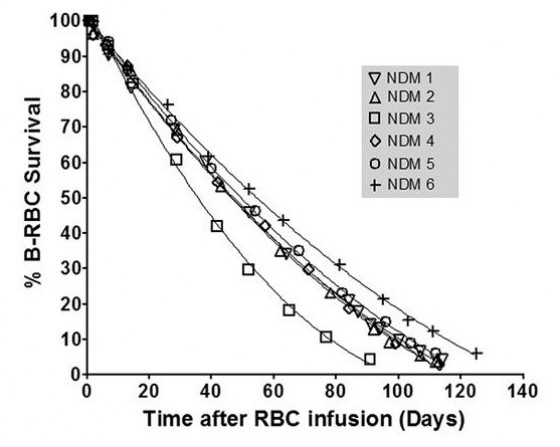
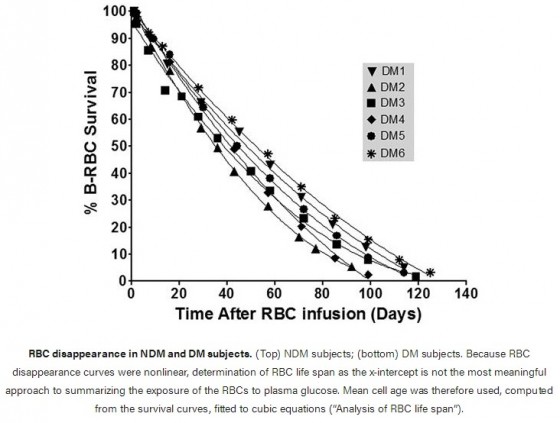
The individual RBC survivals for NDM (top panel) and DM subjects (bottom panel) are shown in Figure 3. These plots, although showing a long, almost linear phase consistent with previous data, are indeed curvilinear. There is heterogeneity in both the overall duration of survival and the shapes of the curves. We chose a cubic fit for the data and used the best fit parameters to estimate the mean age of the RBCs.29 Although there was substantial variation among individuals, there was no significant difference in mean RBC age between groups: 50.7 plus or minus 7.2 days for NDM subjects and 47.9 plus or minus 6.1 days for diabetic subjects (Table 2, P = .46). Corresponding ranges for mean RBC age were 38.4 to 59.5 days and 39.4 to 56.0 days, respectively.
Figure 3
VIEW LARGEDOWNLOAD PPT
RBC disappearance in NDM and DM subjects. (Top) NDM subjects; (bottom) DM subjects. Because RBC disappearance curves were nonlinear, determination of RBC life span as the x-intercept is not the most meaningful approach to summarizing the exposure of the RBCs to plasma glucose. Mean cell age was therefore used, computed from the survival curves, fitted to cubic equations (“Analysis of RBC life span”).
In vivo HbA1c synthesis
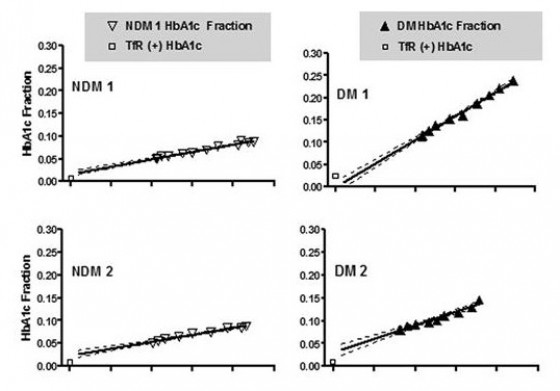
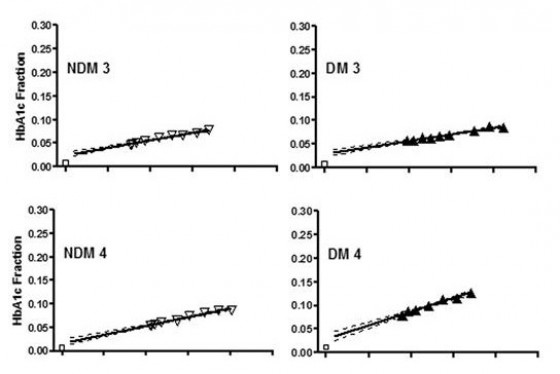
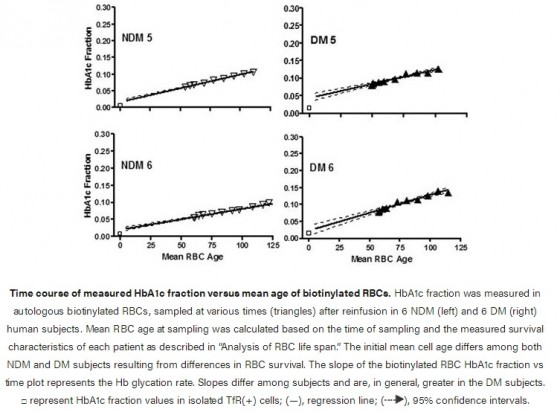
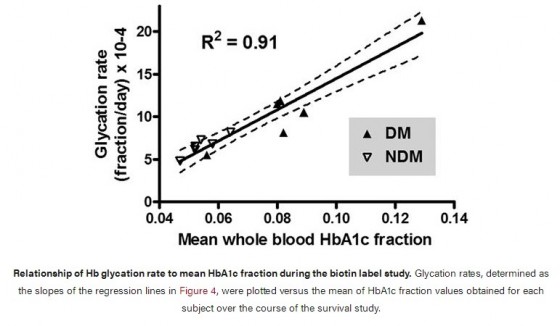
Figure 4 shows HbA1c fraction versus mean RBC age for each subject. The starting mean age of the labeled RBCs corresponds to that of all circulating RBCs at the time of labeling and therefore includes RBCs of all ages. At subsequent time points, the mean RBC age increases and the age range narrows. Data points appear only during the second half of the life span because mean RBC age can only be calculated from the time of labeling. The line fitted to these points was extrapolated to the y intercept for comparison to the HbA1c fraction values of the TfR(+) cells. If the synthesis rate of HbA1c were linear for the entire life span, then ideally the y-intercept would coincide with the HbA1c fraction in the TfR(+) cells. However, for 11 subjects, the TfR(+) HbA1c was low relative to the HbA1c predicted by extrapolation and high in a single subject whose HbA1c was rising during the study. Table 2 summarizes the synthesis rates and TfR(+) values. As expected, linear regression showed a strong relationship between mean blood HbA1c fraction and glycation rate (Figure 5; R2 = 0.91).
Figure 4
VIEW LARGEDOWNLOAD PPT
Time course of measured HbA1c fraction versus mean age of biotinylated RBCs. HbA1c fraction was measured in autologous biotinylated RBCs, sampled at various times (triangles) after reinfusion in 6 NDM (left) and 6 DM (right) human subjects. Mean RBC age at sampling was calculated based on the time of sampling and the measured survival characteristics of each patient as described in “Analysis of RBC life span.” The initial mean cell age differs among both NDM and DM subjects resulting from differences in RBC survival. The slope of the biotinylated RBC HbA1c fraction vs time plot represents the Hb glycation rate. Slopes differ among subjects and are, in general, greater in the DM subjects. □ represent HbA1c fraction values in isolated TfR(+) cells; (—), regression line; (), 95% confidence intervals.
Figure 5
Relationship of Hb glycation rate to mean HbA1c fraction during the biotin label study. Glycation rates, determined as the slopes of the regression lines in Figure 4, were plotted versus the mean of HbA1c fraction values obtained for each subject over the course of the survival study.
VIEW LARGEDOWNLOAD PPT
Discussion
HbA1c has assumed its current role as the “gold standard” for the estimation of mean glycemic control because it is an integrated measure that is highly reproducible and relatively easy and inexpensive to perform. In the clinical setting, HbA1c values are regarded as virtually synonymous with glycemic control despite some ongoing limitations, in part related to methods of measurement.42 Yet, mismatches between HbA1c and mean blood glucose measured by other means are real, common, and relevant to clinical management.5,31 Depending on the mechanism in a particular situation, this mismatch may result from alterations in RBC survival. In an effort to understand this discordance in a quantitative manner at the level of the individual with diabetes, the studies presented here examine for the first time the 3 factors that determine the amount of HbA1c in the blood: (1) the level of HbA1c when immature RBCs enter the circulation, (2) the HbA1c synthetic rate as RBCs age in the circulation, and (3) the average time period over which Hb is exposed to glucose in the circulation (RBC mean age). Of particular clinical relevance, RBC mean age contributes to the intersubject variability in HbA1c fraction independent of the direct effect of glycemic control on HbA1c.
HbA1c synthesis rate
As previously shown with 59Fe in the A1c Hb peak1 in NDM subjects, and now demonstrated with HbA1c measurement directly in both NDM and DM subjects, net in vivo HbA1c synthesis is constant as mean cell age increases under steady-state physiologic and pathophysiologic conditions (Figure 4). This supports that the net glycation reaction in vivo is essentially unidirectional.1,2 If both glycation and deglycation are occurring simultaneously, there is no evidence of a complex time course from mean cell age until cells are removed from the circulation. A deglycating enzyme43 has recently been identified that acts at lysine, but none has been reported that acts at the N-terminal glycated amino group.44 The strong correlation of glycation rate with whole blood HbA1c in the DM and NDM subjects (Figure 5) provides evidence that the whole blood determination depends on the integration of glycation rate throughout the red cell life span. In addition to RBC life span, there may be other variables that either attenuate or amplify the discordances between Hb A1c and average plasma glucose.45 For example, we have proposed heterogeneity in the glucose gradient across the RBC membrane independent of glycemic control as one possibility.46,47 Whereas some authors interpret data as indicating minimal biologic variation in HbA1c between individuals,4 others have found evidence for more marked differences resulting from poorly understood genetic factors.48,49 After the elucidation of the nature of nonenzymatic glycation,50,51 glycation rates have been shown to be subject to variation between individuals by factors that are independent of glucose concentration, including pH,32 inorganic phosphate,52 oxidative stress,53 deglycation,43,54 and Schiff base inhibitors.55 These techniques used here, in combination with frequent blood glucose sampling, could evaluate the importance of these factors.
TfR(+) reticulocyte HbA1c
The HbA1c fraction in isolated TfR(+) reticulocytes was consistently lower than predicted by extrapolating the time course of glycation (Figure 4) to zero time but higher than might be expected by comparing the circulating life span of the RBC to the duration before RBC precursor release (Figure 1; Table 2). The HbA1c peak has been reported to be heterogeneous, and mass spectrometry would be necessary to exclude differences in the composition of this peak between whole blood, TfR(+), and biotinylated cell preparations as a source of this uncertainty.42,56 Nevertheless, HbA1c in isolated TfR(+) reticuloctes correlated with initial whole blood HbA1c and was higher in DM subjects compared with NDM. Given its low value, it is doubtful that variation in reticulocyte HbA1c has a significant impact on HbA1c interpretation.
RBC life span
The most important finding from these studies is the heterogeneity in mean RBC age in hematologically normal people both with and without diabetes. The mean RBC age calculation is based conceptually on methods29 adapted from analogous animal tag-and-release studies30 in which the ages of tagged animals are not known at the time of release. In our case, the ages of the “tagged” biotin-labeled RBCs at the time of reinfusion are not known. The mean RBC age is derived from the mathematical relationship between the disappearance or “death” rate of the biotin-labeled RBCs and their age distribution. It incorporates information derived from the complete survival curve of the biotin-labeled RBCs that have variable initial age. The mean and range of RBC mean age were similar in DM and NDM subjects. Mean RBC age is the appropriate RBC survival variable for these studies because, in the absence of significant bone marrow glycation, it should be the most valid measure of the duration of Hb exposure to glucose in the periphery. In this study, the DM subjects with the poorer glycemic control had the higher mean RBC ages, arguing against an effect of poor glycemic control on RBC survival. These results differ from 2 previous reports8,9 but agree with others.10,12
It is important, in examining these results, to consider the potential sources of variation. The individual survival curves appear to be very precise (R2 > 0.99), and repeated assays at a given time point agreed closely. The range of biotinylation was kept as narrow as possible, and there appeared to be no dependence on the degree of biotinylation within this range. The biotinylation conditions were chosen to give the lowest level of biotin on the RBC that was consistent with baseline separation on the flow cytometer for the entire experiment. Repeated studies on the same subject were not performed, and it remains to be determined whether a patient varies significantly within the observed range of RBC survival.
The 6 subjects with diabetes were selected from a population of approximately 200 patients followed with frequent HbA1c and fructosamine measurements. We have previously reported that in a similar (n = 153) population with the assumption that both HbA1c and fructosamine values are at steady state,36 17% had fructosamine predicting HbA1c at least one percentage point below and 23% had fructosamine predicting HbA1c at least one percentage point above the measured HbA1c and that the direction of deviation between the 2 was consistent over time.36 However, because the fraction of HbA1c-fructosamine discordance attributable to RBC life span variation is not known, it is premature to generalize about the prevalence in a larger population.
The impact of mean red cell age on HbA1c
In this study of 12 DM and NDM subjects, substantial variability of RBC life span was observed, with mean cell age ranging from 38.4 to 59.5 days representing 20% above and below the mean for the combined population (49.3 ± 6.3). Based on the mean HbA1c fraction value (0.086) and the mean RBC age of the DM subjects (47.9 days) and the average rate of glycation observed in the DM subjects (0.00115/day; Table 2), it is possible to define a relationship between HbA1c fraction and cell age for the “average” diabetic patient as:
HbA1c = 0.00115 × cell age + 0.0309.
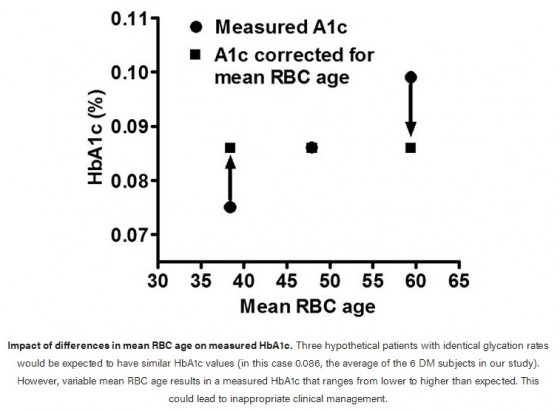
The intercept is determined mathematically by the other 3 parameters. This relationship is useful in calculating the impact of assuming that all RBC have the same survival time. It can be calculated that the HbA1c fraction at 38.4 days would be 0.075, 0.086 at 47.9 days, and 0.099 at 59.5 days. Thus, 3 patients with otherwise identical diabetic control could have very different HbA1c levels of 0.075 or 0.099 if they happened to have mean RBC ages of 38.4 and 59.5 days, respectively (Figure 6). These differences in HbA1c are of a magnitude that would affect management decisions. An ostensibly acceptable HbA1c that would not prompt a change in management may actually be unacceptably high if a shorter RBC survival were taken into account; and at the other extreme, the measured HbA1c may correct to one much lower if a longer RBC life span is considered. In the latter case, inappropriately aggressive therapy might be instituted, with increased risk for hypoglycemia. Although the number of patients studied thus far is not sufficient to calculate an accurate population distribution of mean RBC ages, the data on these 12 patients suggest a range encompassing 2 SDs of 36 to 62 days, assuming a normal distribution. Even if RBC life span is a factor in determining HbA1c levels in only 5% to 10% of people with diabetes, that amounts to 1 to 2 million people in the United States alone and many more worldwide.
Figure 6
HbA1c as a surrogate marker for red cell survival in erythrocyte disease
Although the findings in this study are limited to subjects with normal hemoglobin, hematocrit, indices, and reticulocyte count, there are implications for assessment of hematologic disease by HbA1c. Detection of altered red cell survival was among the early implications demonstrated when red cell physiology was examined in relation to HbA1c. Subsequent studies have extended this principle to assessment of severity of hemolysis/shortened survival57,58 and sensitive detection of mild hematologic disorders.59,60 These studies demonstrate that there may be differences in red cell survival that are not evident by examination of HbA1c solely in relation to its own normal range. These alterations in RBC survival may become more readily detectable by comparison of HbA1c to another test of glycemic control relative to its own reference range.36 Conversely, the differential diagnosis of an abnormal HbA1c in a person with normoglycemia may include alterations in RBC survival, hemoglobin structure, and Hb glycation rate for a given blood glucose.
In conclusion, our studies show that (1) reticulocyte HbA1c glycation is closely related to the whole blood HbA1c in diabetes but is too small a fraction of total HbA1c to cause discordance in clinical results; (2) in vivo HbA1c synthesis is linear with time and correlates with whole blood HbA1c; and (3) RBC survival varies sufficiently among hematologically normal people to cause clinically important differences in HbA1c. We did not detect a difference in RBC life span between NDM and DM subjects, although the study population was small. These studies demonstrate an approach to identify the physiologic basis of discordance between HbA1c and other measures of glycemic control, and provide a more complete understanding of the multiple factors that determine HbA1c in whole blood.
The publication costs of this article were defrayed in part by page charge payment. Therefore, and solely to indicate this fact, this article is hereby marked “advertisement” in accordance with 18 USC section 1734.
Acknowledgments
The authors thank the participants for their contribution to these studies and the Cincinnati VA General Clinical Research Center Satellite nursing staff, M. Colleen Rogge, Fay Hailes, and Cathy Bailey.
This work was supported by the National Institutes of Health (Bethesda, MD; grants R01 DK63088 [R.M.C.] and M01 RR 08 084).
National Institutes of Health
Authorship
Contribution: R.M.C., R.S.F., C.H.J., and C.J.L. designed the research, analyzed the data, and wrote the paper; E.P.S. analyzed the data and wrote the paper; and P.J.C., M.B.P., and P.K.K. conducted the research and edited the paper.
Conflict-of-interest disclosure: The authors declare no competing financial interests.
Correspondence: Robert M. Cohen, Division of Endocrinology, Diabetes and Metabolism, Department of Medicine, University of Cincinnati College of Medicine, Vontz Center for Molecular Studies, 3125 Eden Avenue, Cincinnati, OH 45267-0547; e-mail: robert.cohen@uc.edu.
References
1 Bunn HF, Haney DN, Kamin S, Gabbay KH, Gallop PM. The biosynthesis of human hemoglobin A1c: slow glycosylation of hemoglobin in vivo., J Clin Invest, 1976, vol. 57 (pg. 1652-1659)
Google ScholarCrossref PubMed
2 Higgins PJ, Bunn HF. Kinetic analysis of the nonenzymatic glycosylation of hemoglobin., J Biol Chem, 1981, vol. 256 (pg. 5204-5208)
Google ScholarPubMed
3 Svendsen PA, Christiansen JS, Soegaard U, Nerup J. Synthesis of glycosylated haemoglobin in vivo., Diabetologia, 1981, vol. 21 (pg. 549-553)
Google ScholarCrossref PubMed
4 Rohlfing C, Wiedmeyer HM, Little R, et al. Biological variation of glycohemoglobin., Clin Chem, 2002, vol. 48 (pg. 1116-1118)
Google ScholarPubMed
5 Nathan DM, Singer DE, Hurxthal K, Goodson JD. The clinical information value of the glycosylated hemoglobin assay., N Engl J Med, 1984, vol. 310 (pg. 341-346)
Google ScholarCrossref PubMed
6 Berlin NI, Waldmann TA, Weissman SM. Life span of red blood cell., Physiol Rev, 1959, vol. 39 (pg. 577-616)
Google ScholarCrossref PubMed
7 Eadie GS, Brown IW. The potential life span and ultimate survival of fresh red blood cells in normal healthy recipients as studied by simultaneous Cr51 tagging and differential hemolysis., J Clin Invest, 1955, vol. 34 (pg. 629-636)
Google ScholarCrossref PubMed
8 Strocchi A, Schwartz S, Ellefson M, et al. A simple carbon monoxide breath test to estimate erythrocyte turnover., J Lab Clin Med, 1992, vol. 120 (pg. 392-399)
Google ScholarPubMed
9 Virtue MA, Furne JK, Nuttall FQ, Levitt MD. Relationship between GHb concentration and erythrocyte survival determined from breath carbon monoxide concentration., Diabetes Care, 2004, vol. 27 (pg. 931-935)
Google ScholarCrossref PubMed
10 Sayinalp S, Sozen T, Usman A, Dundar S. Investigation of the effect of poorly controlled diabetes mellitus on erythrocyte life., J Diabetes Complications, 1995, vol. 9 (pg. 190-193)
Google ScholarCrossref PubMed
11 Mitlyng BL, Chandrashekhar Y, Furne JK, Levitt MD. Use of breath carbon monoxide to measure the influence of prosthetic heart valves on erythrocyte survival., Am J Cardiol, 2006, vol. 97 (pg. 1374-1376)
Google ScholarCrossref PubMed
12 Peterson CM, Jones RL, Koenig RJ, Melvin ET, Lehrman ML. Reversible hematologic sequelae of diabetes mellitus., Ann Intern Med, 1977, vol. 86 (pg. 425-429)
Google ScholarCrossref PubMed
13 Fitzgibbons JF, Koler RD, Jones RT. Red cell age-related changes of hemoglobins AIa+b and AIc in normal and diabetic subjects., J Clin Invest, 1976, vol. 58 (pg. 820-824)
Google ScholarCrossref PubMed
14 Leitch JM, Carruthers A. ATP-dependent sugar transport complexity in human erythrocytes., Am J Physiol Cell Physiol, 2007, vol. 292 (pg. C974-C986)
Google ScholarCrossref PubMed
15 Willekens FL, Roerdinkholder-Stoelwinder B, Groenen-Dopp YA, et al. Hemoglobin loss from erythrocytes in vivo results from spleen-facilitated vesiculation., Blood, 2003, vol. 101 (pg. 747-751)
ArticleGoogle ScholarCrossref PubMed
16 D'Onofrio G, Chirillo R, Zini G, et al. Simultaneous measurement of reticulocyte and red blood cell indices in healthy subjects and patients with microcytic and macrocytic anemia., Blood, 1995, vol. 85 (pg. 818-823)
ArticleGoogle ScholarCrossref PubMed
17 Russo V, Barker-Gear R, Gates R, Franco R. Studies with biotinylated RBC: (1) use of flow cytometry to determine posttransfusion survival and (2) isolation using streptavidin conjugated magnetic beads., Adv Exp Med Biol, 1992, vol. 326 (pg. 101-107)
Google ScholarPubMed
18 Kumpel BM, Austin EB, Lee D, et al. Comparison of flow cytometric assays with isotopic assays of (51)chromium-labeled cells for estimation of red cell clearance or survival in vivo., Transfusion, 2000, vol. 40 (pg. 228-239)
Google ScholarCrossref PubMed
19 Mock DM, Lankford GL, Widness JA, et al. Measurement of red cell survival using biotin-labeled red cells: validation against 51Cr-labeled red cells., Transfusion, 1999, vol. 39 (pg. 156-162)
Google ScholarCrossref PubMed
20 Zimran A, Forman L, Suzuki T, Dale GL, Beutler E. In vivo aging of red cell enzymes: study of biotinylated red blood cells in rabbits., Am J Hematol, 1990, vol. 33 (pg. 249-254)
Google ScholarCrossref PubMed
21 Waugh RE, Narla M, Jackson CW, et al. Rheologic properties of senescent erythrocytes: loss of surface area and volume with red blood cell age., Blood, 1992, vol. 79 (pg. 1351-1358)
ArticleGoogle ScholarCrossref PubMed
22 Dale GL, Norenberg SL. Density fractionation of erythrocytes by Percoll/hypaque results in only a slight enrichment for aged cells., Biochim Biophys Acta, 1990, vol. 1036 (pg. 183-187)
Google ScholarCrossref PubMed
23 Suzuki T, Dale GL. Biotinylated erythrocytes: in vivo survival and in vitro recovery., Blood, 1987, vol. 70 (pg. 791-795)
ArticleGoogle ScholarCrossref PubMed
24 Dale GL, Daniels RB. Quantitation of immunoglobulin associated with senescent erythrocytes from the rabbit., Blood, 1991, vol. 77 (pg. 1096-1099)
ArticleGoogle ScholarCrossref PubMed
25 Hoffmann-Fezer G, Mysliwietz J, Mortlbauer W, et al. Biotin labeling as an alternative nonradioactive approach to determination of red cell survival., Ann Hematol, 1993, vol. 67 (pg. 81-87)
Google ScholarCrossref PubMed
26 Christian JA, Rebar AH, Boon GD, Low PS. Senescence of canine biotinylated erythrocytes: increased autologous immunoglobulin binding occurs on erythrocytes aged in vivo for 104 to 110 days., Blood, 1993, vol. 82 (pg. 3469-3473)
ArticleGoogle ScholarCrossref PubMed
27 Cavill I, Trevett D, Fisher J, Hoy T. The measurement of the total volume of red cells in man: a non-radioactive approach using biotin., Br J Haematol, 1988, vol. 70 (pg. 491-493)
Google ScholarCrossref PubMed
28 Cohen RM, Franco RS, Joiner CH. Is poor glycemic control associated with reduced red blood cell life span?, Diabetes Care, 2004, vol. 27 (pg. 1013-1014)
Google ScholarCrossref PubMed
29 Lindsell CJ, Franco RS, Smith EP, Joiner CH, Cohen RM. A method for the continuous calculation of the age of labeled red blood cells., Am J Hematol, 2008, vol. 83 (pg. 454-457)
Google ScholarCrossref PubMed
30 Muller HG, Wang JL, Carey JR, et al. Demographic window to aging in the wild: constructing life tables and estimating survival functions from marked individuals of unknown age., Aging Cell, 2004, vol. 3 (pg. 125-131)
Google ScholarCrossref PubMed
31 Kilpatrick ES, Rigby AS, Atkin SL. Variability in the relationship between mean plasma glucose and HbA1c: implications for the assessment of glycemic control., Clin Chem, 2007, vol. 53 (pg. 897-901)
Google ScholarCrossref PubMed
32 Gould BJ, Davie SJ, Yudkin JS. Investigation of the mechanism underlying the variability of glycated haemoglobin in non-diabetic subjects not related to glycaemia., Clin Chim Acta, 1997, vol. 260 (pg. 49-64)
Google ScholarCrossref PubMed
33 Hempe JM, Gomez R, McCarter RJ, Chalew SA. High and low hemoglobin glycation phenotypes in type 1 diabetes: a challenge for interpretation of glycemic control., J Diabetes Complications, 2002, vol. 16 (pg. 313-320)
Google ScholarCrossref PubMed
34 Hassan Y, Johnson B, Nader N, Gannon MC, Nuttall FQ. The relationship between 24-hour integrated glucose concentrations and % glycohemoglobin., J Lab Clin Med, 2006, vol. 147 (pg. 21-26)
Google ScholarCrossref PubMed
35 Nuttall FQ, Gannon MC, Swaim WR, Adams MJ. Stability over time of glycohemoglobin, glucose, and red blood cell survival in hematologically stable people without diabetes., Metabolism, 2004, vol. 53 (pg. 1399-1404)
Google ScholarCrossref PubMed
36 Cohen RM, Holmes YR, Chenier TC, Joiner CH. Discordance between HbA1c and fructosamine: evidence for a glycosylation gap and its relation to diabetic nephropathy., Diabetes Care, 2003, vol. 26 (pg. 163-167)
Google ScholarCrossref PubMed
37 Brun A, Gaudernack G, Sandberg S. A new method for isolation of reticulocytes: positive selection of human reticulocytes by immunomagnetic separation., Blood, 1990, vol. 76 (pg. 2397-2403)
ArticleGoogle ScholarCrossref PubMed
38 Franco RS, Barker-Gear R, Miller MA, et al. Fetal hemoglobin and potassium in isolated transferrin receptor-positive dense sickle reticulocytes., Blood, 1994, vol. 84 (pg. 2013-2020)
ArticleGoogle ScholarCrossref PubMed
39 Franco RS, Lohmann J, Silberstein EB, et al. Time-dependent changes in the density and hemoglobin F content of biotin-labeled sickle cells., J Clin Invest, 1998, vol. 101 (pg. 2730-2740)
Google ScholarCrossref PubMed
40 Franco RS, Yasin Z, Palascak MB, et al. The effect of fetal hemoglobin on the survival characteristics of sickle cells., Blood, 2006, vol. 108 (pg. 1073-1076)
ArticleGoogle ScholarCrossref PubMed
41 Ou CN, Rognerud CL. Rapid analysis of hemoglobin variants by cation-exchange HPLC., Clin Chem, 1993, vol. 39 (pg. 820-824)
Google ScholarPubMed
42 Peterson KP, Pavlovich JG, Goldstein D, et al. What is hemoglobin A1c? An analysis of glycated hemoglobins by electrospray ionization mass spectrometry., Clin Chem, 1998, vol. 44 (pg. 1951-1958)
Google ScholarPubMed
43 Szwergold BS, Howell S, Beisswenger PJ. Human fructosamine-3-kinase: purification, sequencing, substrate specificity, and evidence of activity in vivo., Diabetes, 2001, vol. 50 (pg. 2139-2147)
Google ScholarCrossref PubMed
44 Conner JR, Beisswenger PJ, Szwergold BS. Some clues as to the regulation, expression, function, and distribution of fructosamine-3-kinase and fructosamine-3-kinase-related protein8., Ann NY Acad Sci, 2005, vol. 1043 (pg. 824-836)
Google ScholarCrossref PubMed
45 Goodall I. HbA1c standardisation destination—global IFCC Standardisation. How, why, where and when—a tortuous pathway from kit manufacturers, via inter-laboratory lyophilized and whole blood comparisons to designated national comparison schemes., Clin Biochem Rev, 2005, vol. 26 (pg. 5-19)
Google ScholarPubMed
46 Khera PK, Joiner CH, Carruthers A, et al. Evidence for inter-individual variation in the glucose gradient across the human RBC membrane and its relationship to Hb1c., Diabetes, 2008, vol. 57 (pg. 2445-2452)
Google ScholarCrossref PubMed
47 Cohen RM. A1C: does one size fit all?, Diabetes Care, 2007, vol. 30 (pg. 2756-2758)
Google ScholarCrossref PubMed
48 Snieder H, Sawtell PA, Ross L, et al. HbA(1c) levels are genetically determined even in type 1 diabetes: evidence from healthy and diabetic twins., Diabetes, 2001, vol. 50 (pg. 2858-2863)
Google ScholarCrossref PubMed
49 Cohen RM, Snieder H, Lindsell CJ, et al. Evidence for independent heritability of the glycation gap (glycosylation gap) fraction of HbA1c in nondiabetic twins., Diabetes Care, 2006, vol. 29 (pg. 1739-1743)
Google ScholarCrossref PubMed
50 Bunn HF, Haney DN, Gabbay KH, Gallop PM. Further identification of the nature and linkage of the carbohydrate in hemoglobin A1c., Biochem Biophys Res Commun, 1975, vol. 67 (pg. 103-109)
Google ScholarCrossref PubMed
51 Koenig RJ, Blobstein SH, Cerami A. Structure of carbohydrate of hemoglobin AIc 5., J Biol Chem, 1977, vol. 252 (pg. 2992-2997)
Google ScholarPubMed
52 Kunika K, Itakura M, Yamashita K. Inorganic phosphate accelerates hemoglobin A1c synthesis., Life Sci, 1989, vol. 45 (pg. 623-630)
Google ScholarCrossref PubMed
53 Selvaraj N, Bobby Z, Sathiyapriya V. Effect of lipid peroxides and antioxidants on glycation of hemoglobin: an in vitro study on human erythrocytes., Clin Chim Acta, 2006, vol. 366 (pg. 190-195)
Google ScholarCrossref PubMed
54 Delpierre G, Collard F, Fortpied J, Van SE. Fructosamine 3-kinase is involved in an intracellular deglycation pathway in human erythrocytes., Biochem J, 2002, vol. 365 (pg. 801-808)
Google ScholarCrossref PubMed
55 Szwergold BS, Howell SK, Beisswenger PJ. Transglycation: a potential new mechanism for deglycation of Schiff's bases., Ann NY Acad Sci, 2005, vol. 1043 (pg. 845-864)
Google ScholarCrossref PubMed
56 Lapolla A, Tubaro M, Reitano R, et al. The complexity of non-enzymatic glycation product sets of human globins., Diabetologia, 2004, vol. 47 (pg. 1712-1715)
Google ScholarCrossref PubMed
57 Panzer S, Graninger W, Kronik G, Bettelheim P, Lechner K. Glycosylated hemoglobin as a long-term parameter in appraising the severity of hemolytic disease., Klin Wochenschr, 1983, vol. 61 (pg. 839-843)
Google ScholarCrossref PubMed
58 Panzer S, Kronik G, Lechner K, et al. Glycosylated hemoglobins (GHb): an index of red cell survival., Blood, 1982, vol. 59 (pg. 1348-1350)
ArticleGoogle ScholarCrossref PubMed
59 Coban E, Ozdogan M, Timuragaoglu A. Effect of iron deficiency anemia on the levels of hemoglobin A1c in nondiabetic patients., Acta Haematol, 2004, vol. 112 (pg. 126-128)
Google ScholarCrossref PubMed
60 Aslan D, Gursel T. The usefulness of glycosylated hemoglobin (HbA1C) in discriminating between iron deficiency and thalassemia., Pediatr Hematol Oncol, 2006, vol. 23 (pg. 307-315)


